The console
Open any figure in the brief and see how it was computed
Your team sees the same numbers in the console as in the morning brief, because both come from the same records. Every figure opens to the formula and the inputs behind it, so nobody rebuilds it by hand.

The brief
One brief each morning, before 08:00 in your local time
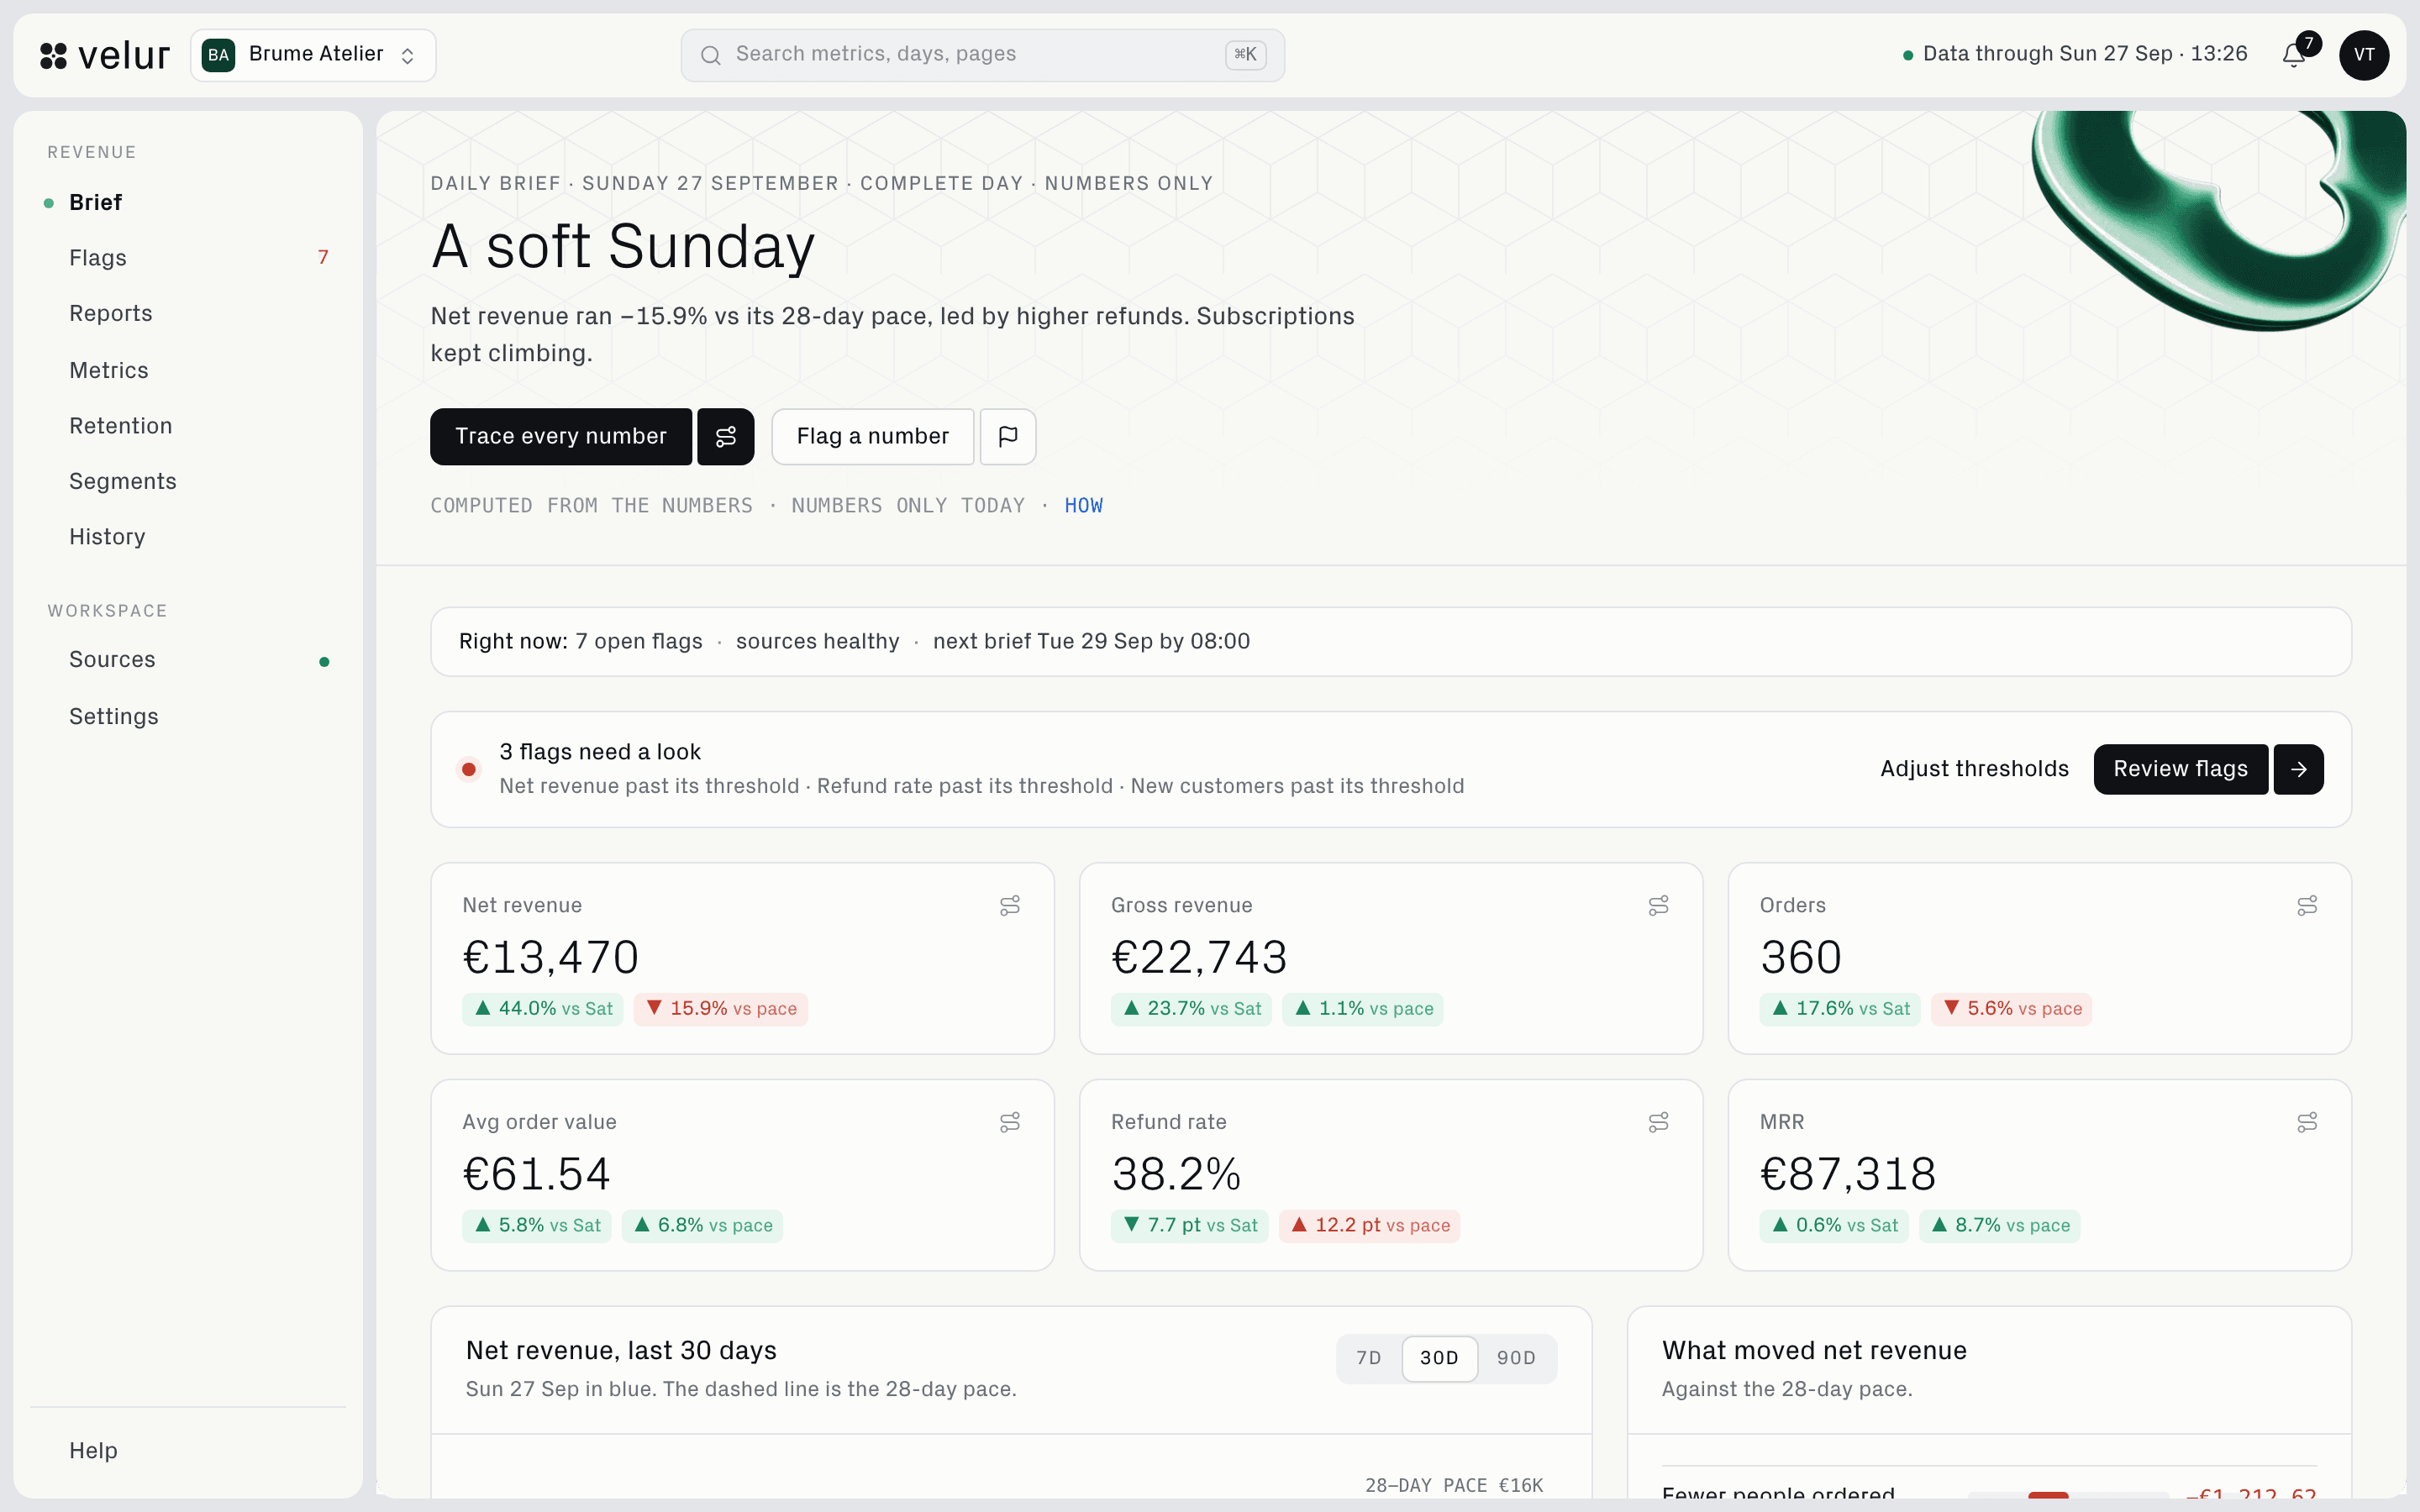
It opens with one sentence on the day, then the eleven figures against their own pace, then what to watch.
We wait until every source has finished syncing the day, then compute the eleven figures from your own records. Nothing in the brief is estimated.
- The day's headline and the sentence that explains it
- The headline figures, each against yesterday and its own trailing 28-day pace
- The flags that need a look, and net revenue over the last thirty days
Flags
We flag the day that lands far from its usual pace
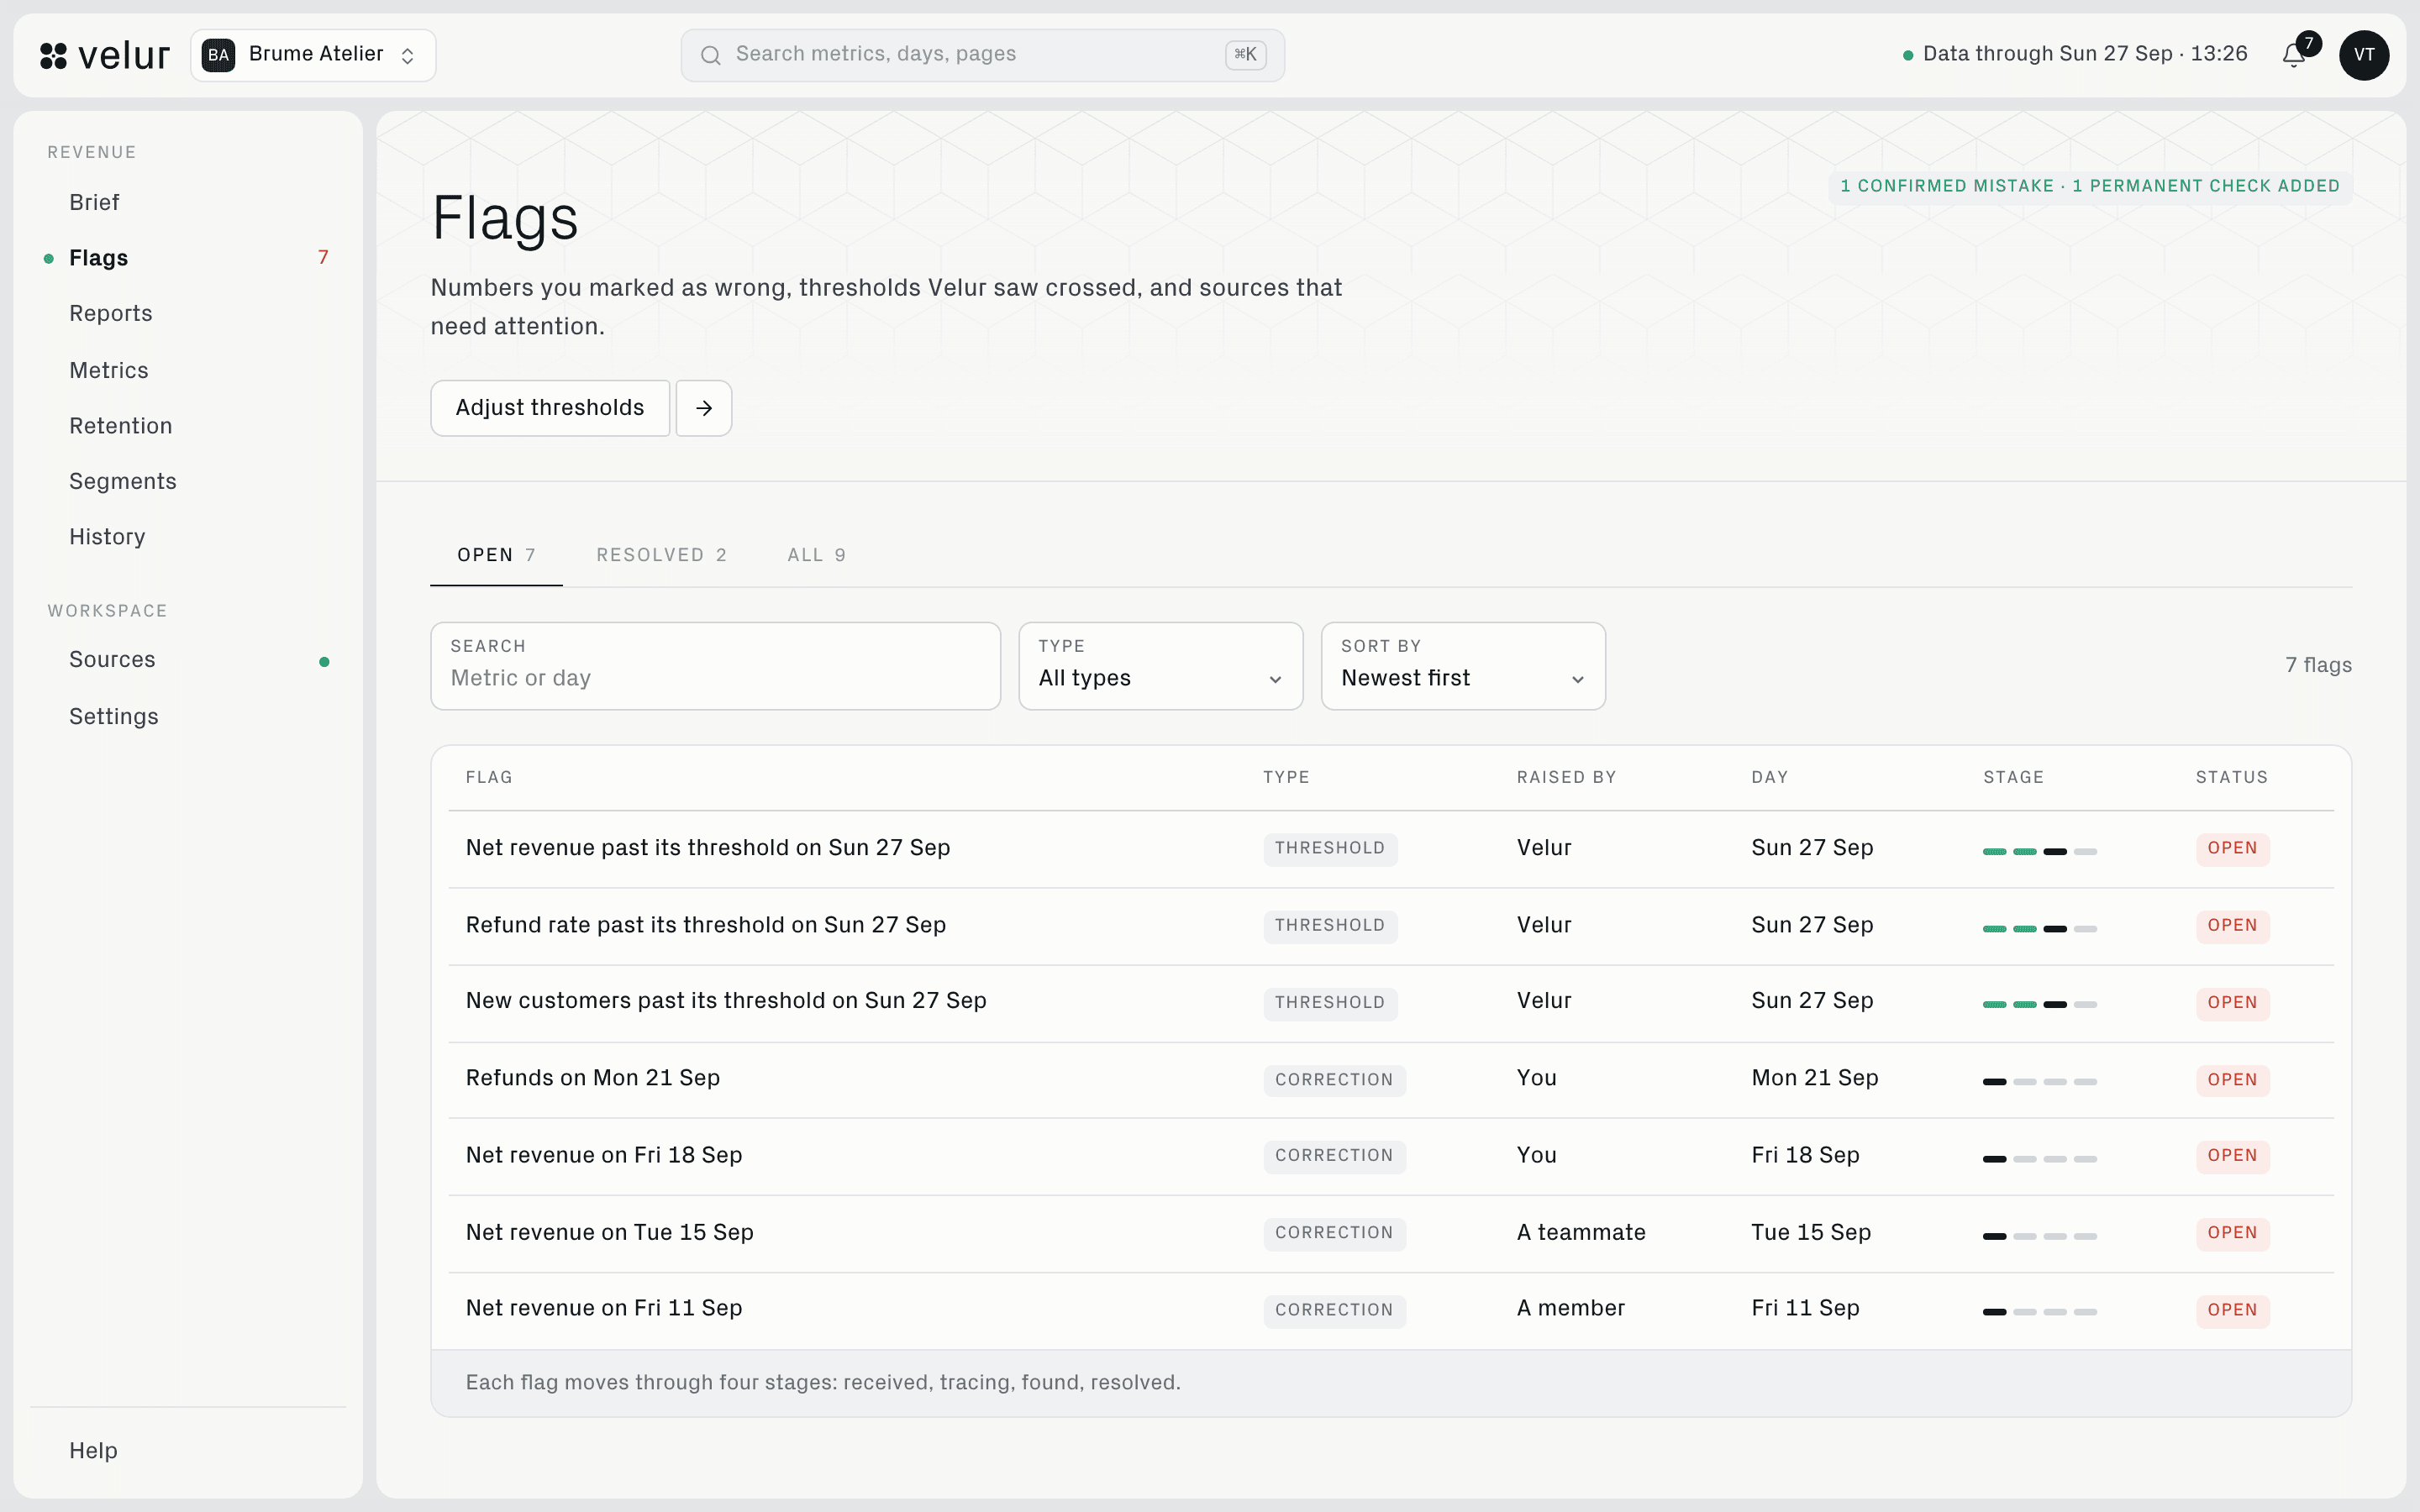
Your flags and ours sit in one list and move through the same four steps.
Each rule compares the day with its own trailing 28-day pace, against a threshold your workspace sets. The rule is fixed arithmetic, with no model and no score.
- Open, resolved and all flags, each naming the figure, the day and who raised it
- Every flag moves through the same four steps: received, tracing, found, resolved
- Thresholds we saw crossed and corrections your team raised, in one list

Reports
You can read the week, the month and the quarter against pace
Each one is assembled from days we have already computed, so a report and the brief can never disagree.
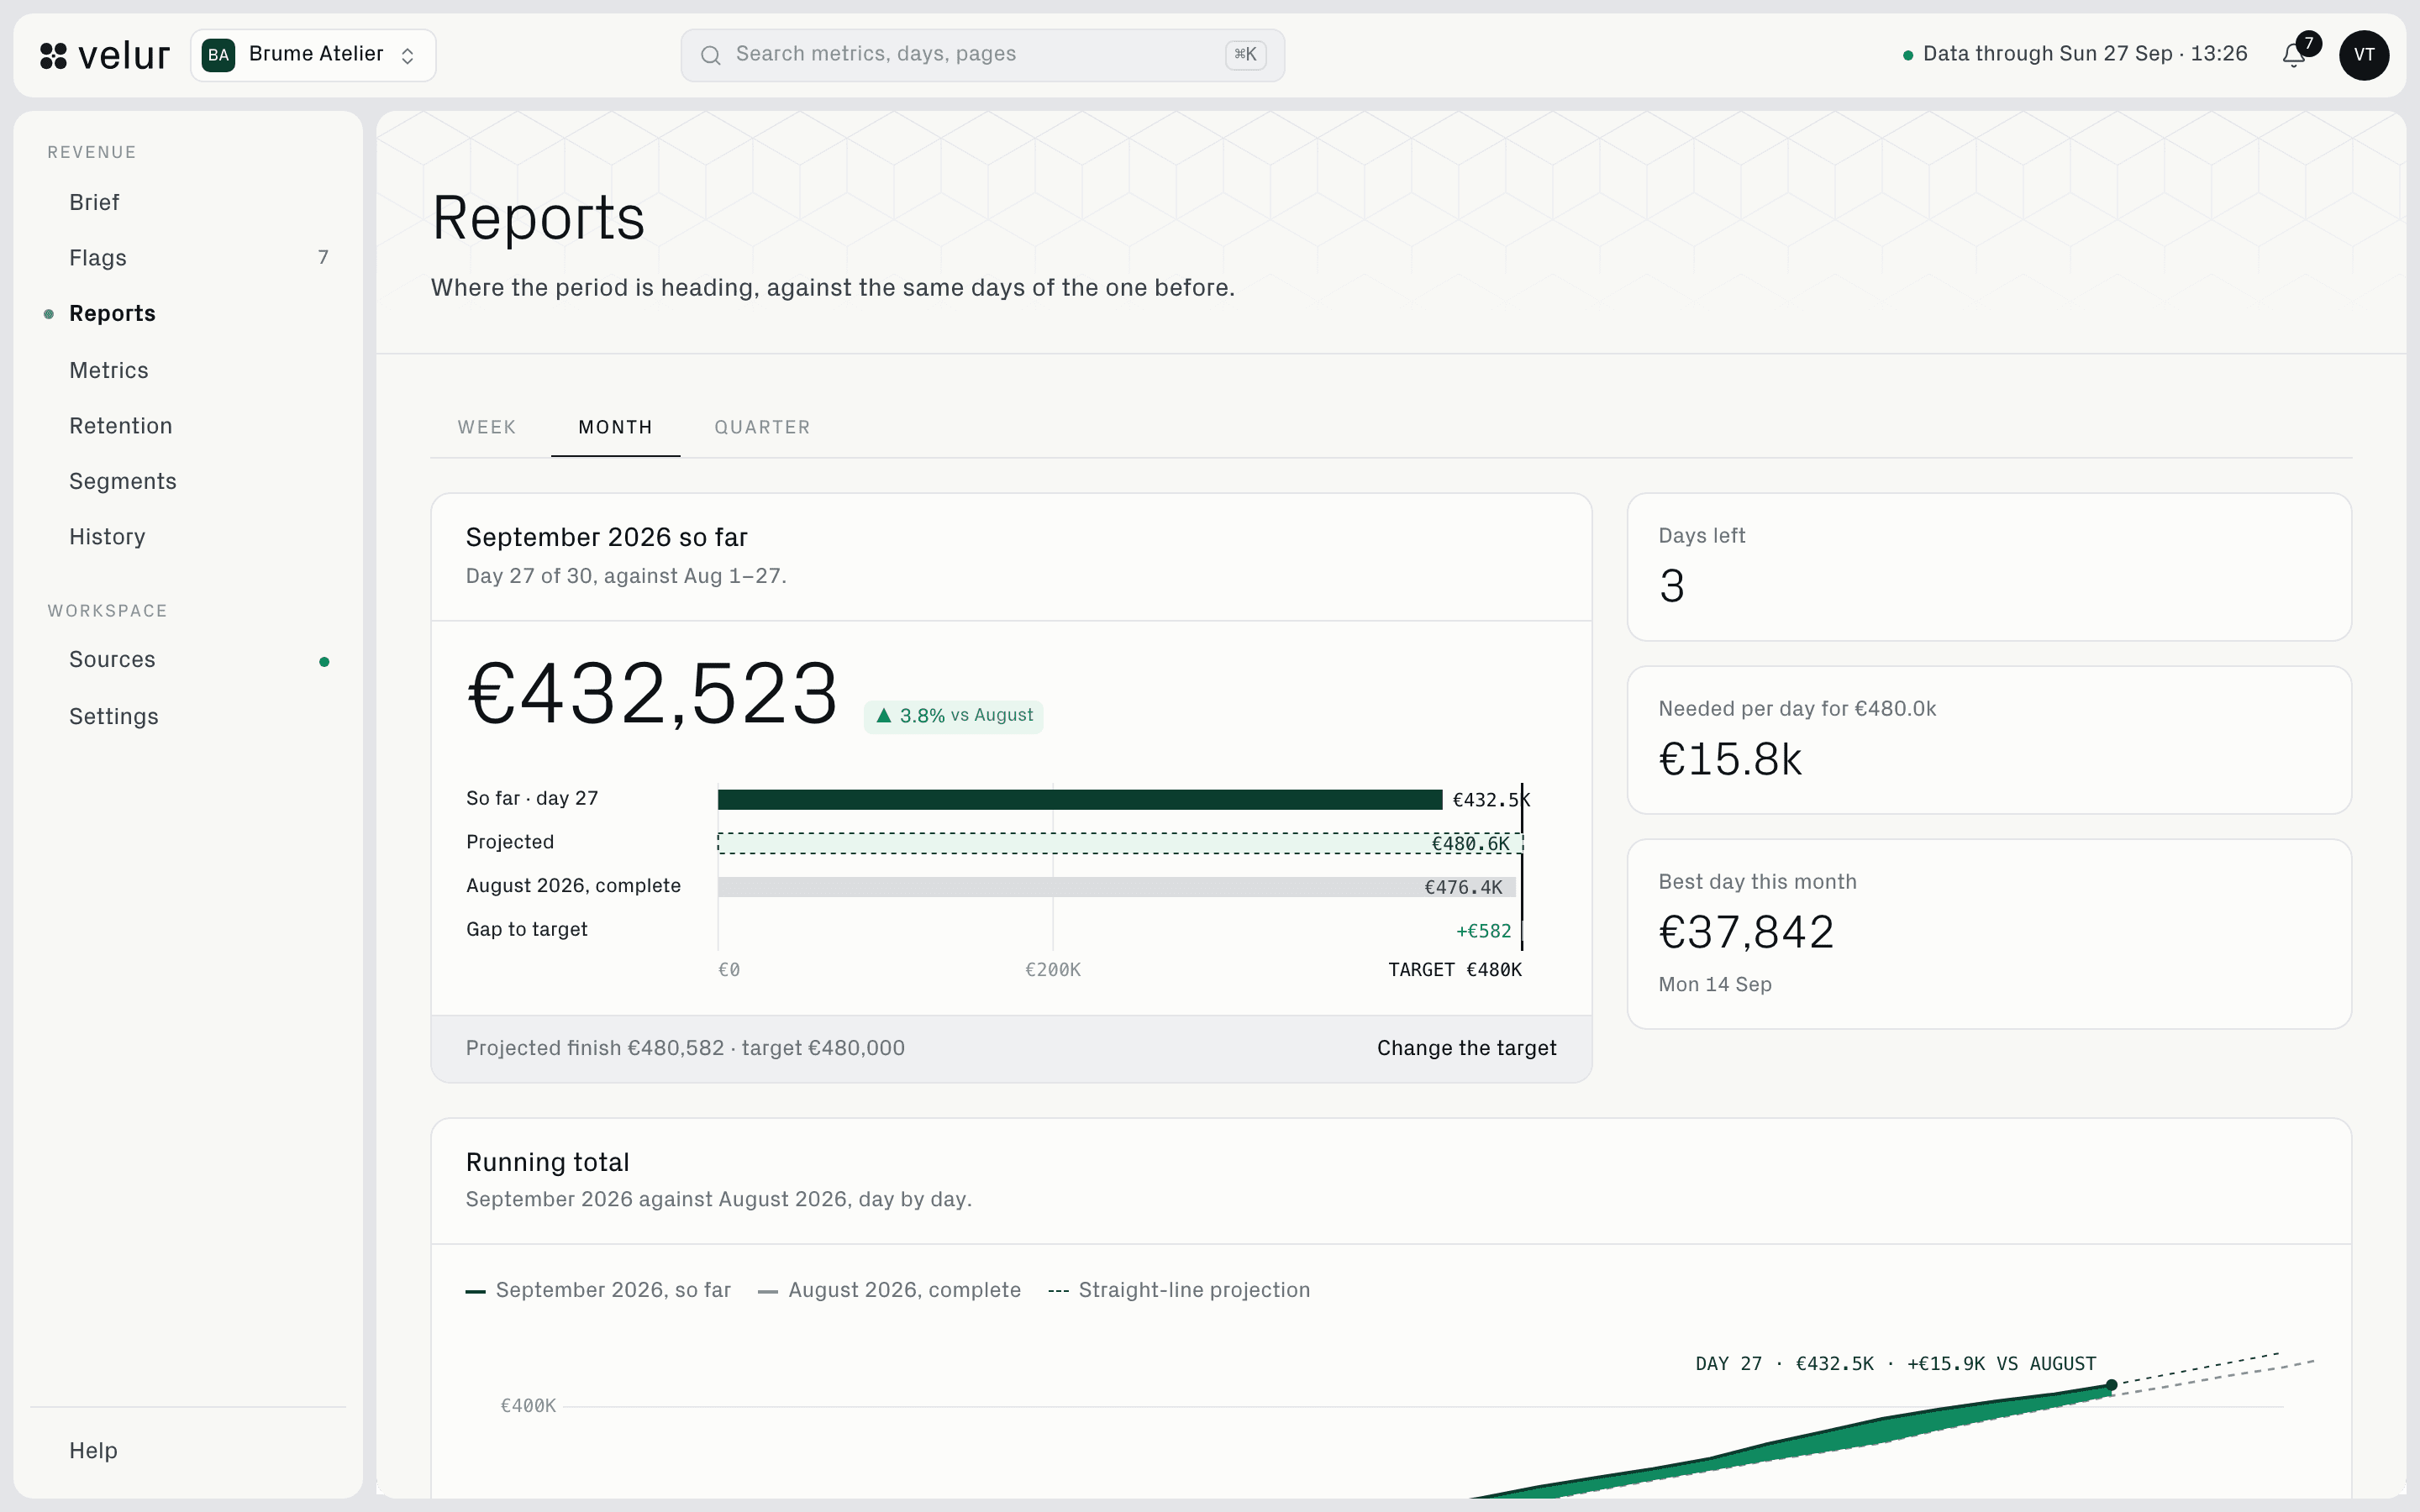
Set a monthly target and we pace the month against it from day one: where you are, where the month lands, and which figures explain the gap.
- Where the month stands against the target you set, and where it lands at the current pace
- This month so far beside last month complete, figure by figure
- What each remaining day needs to reach the target, and the best day so far
Metrics
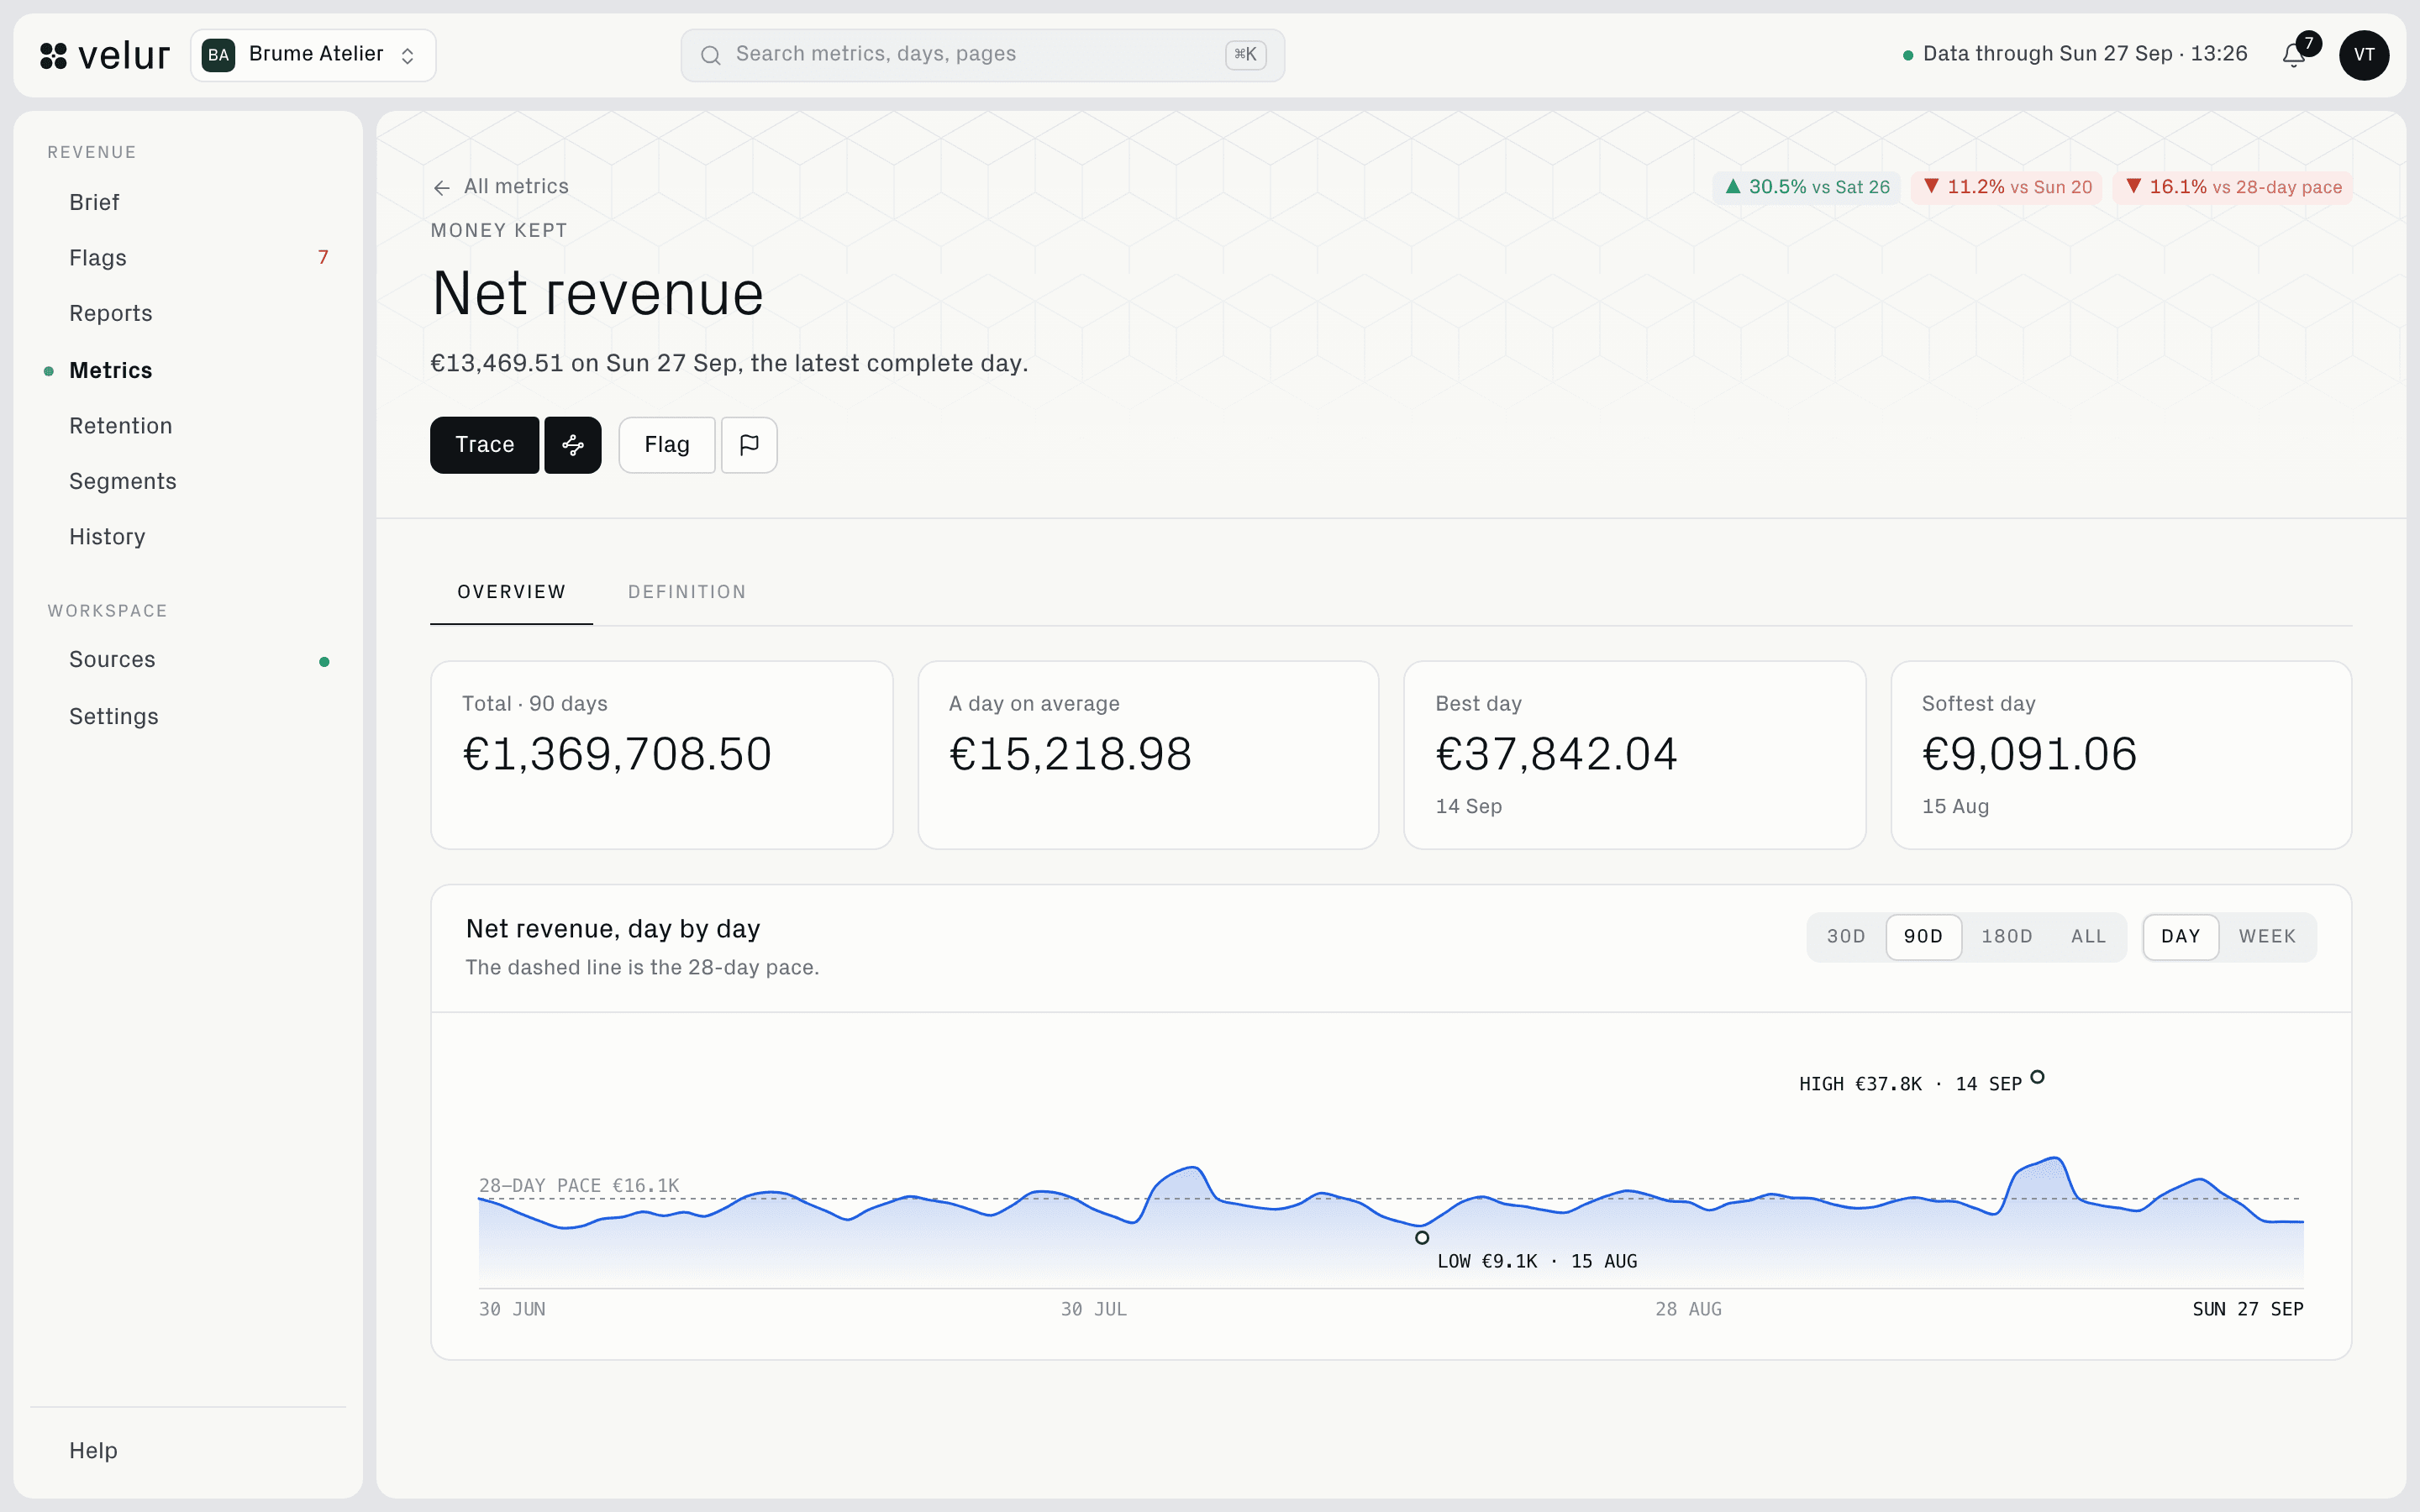
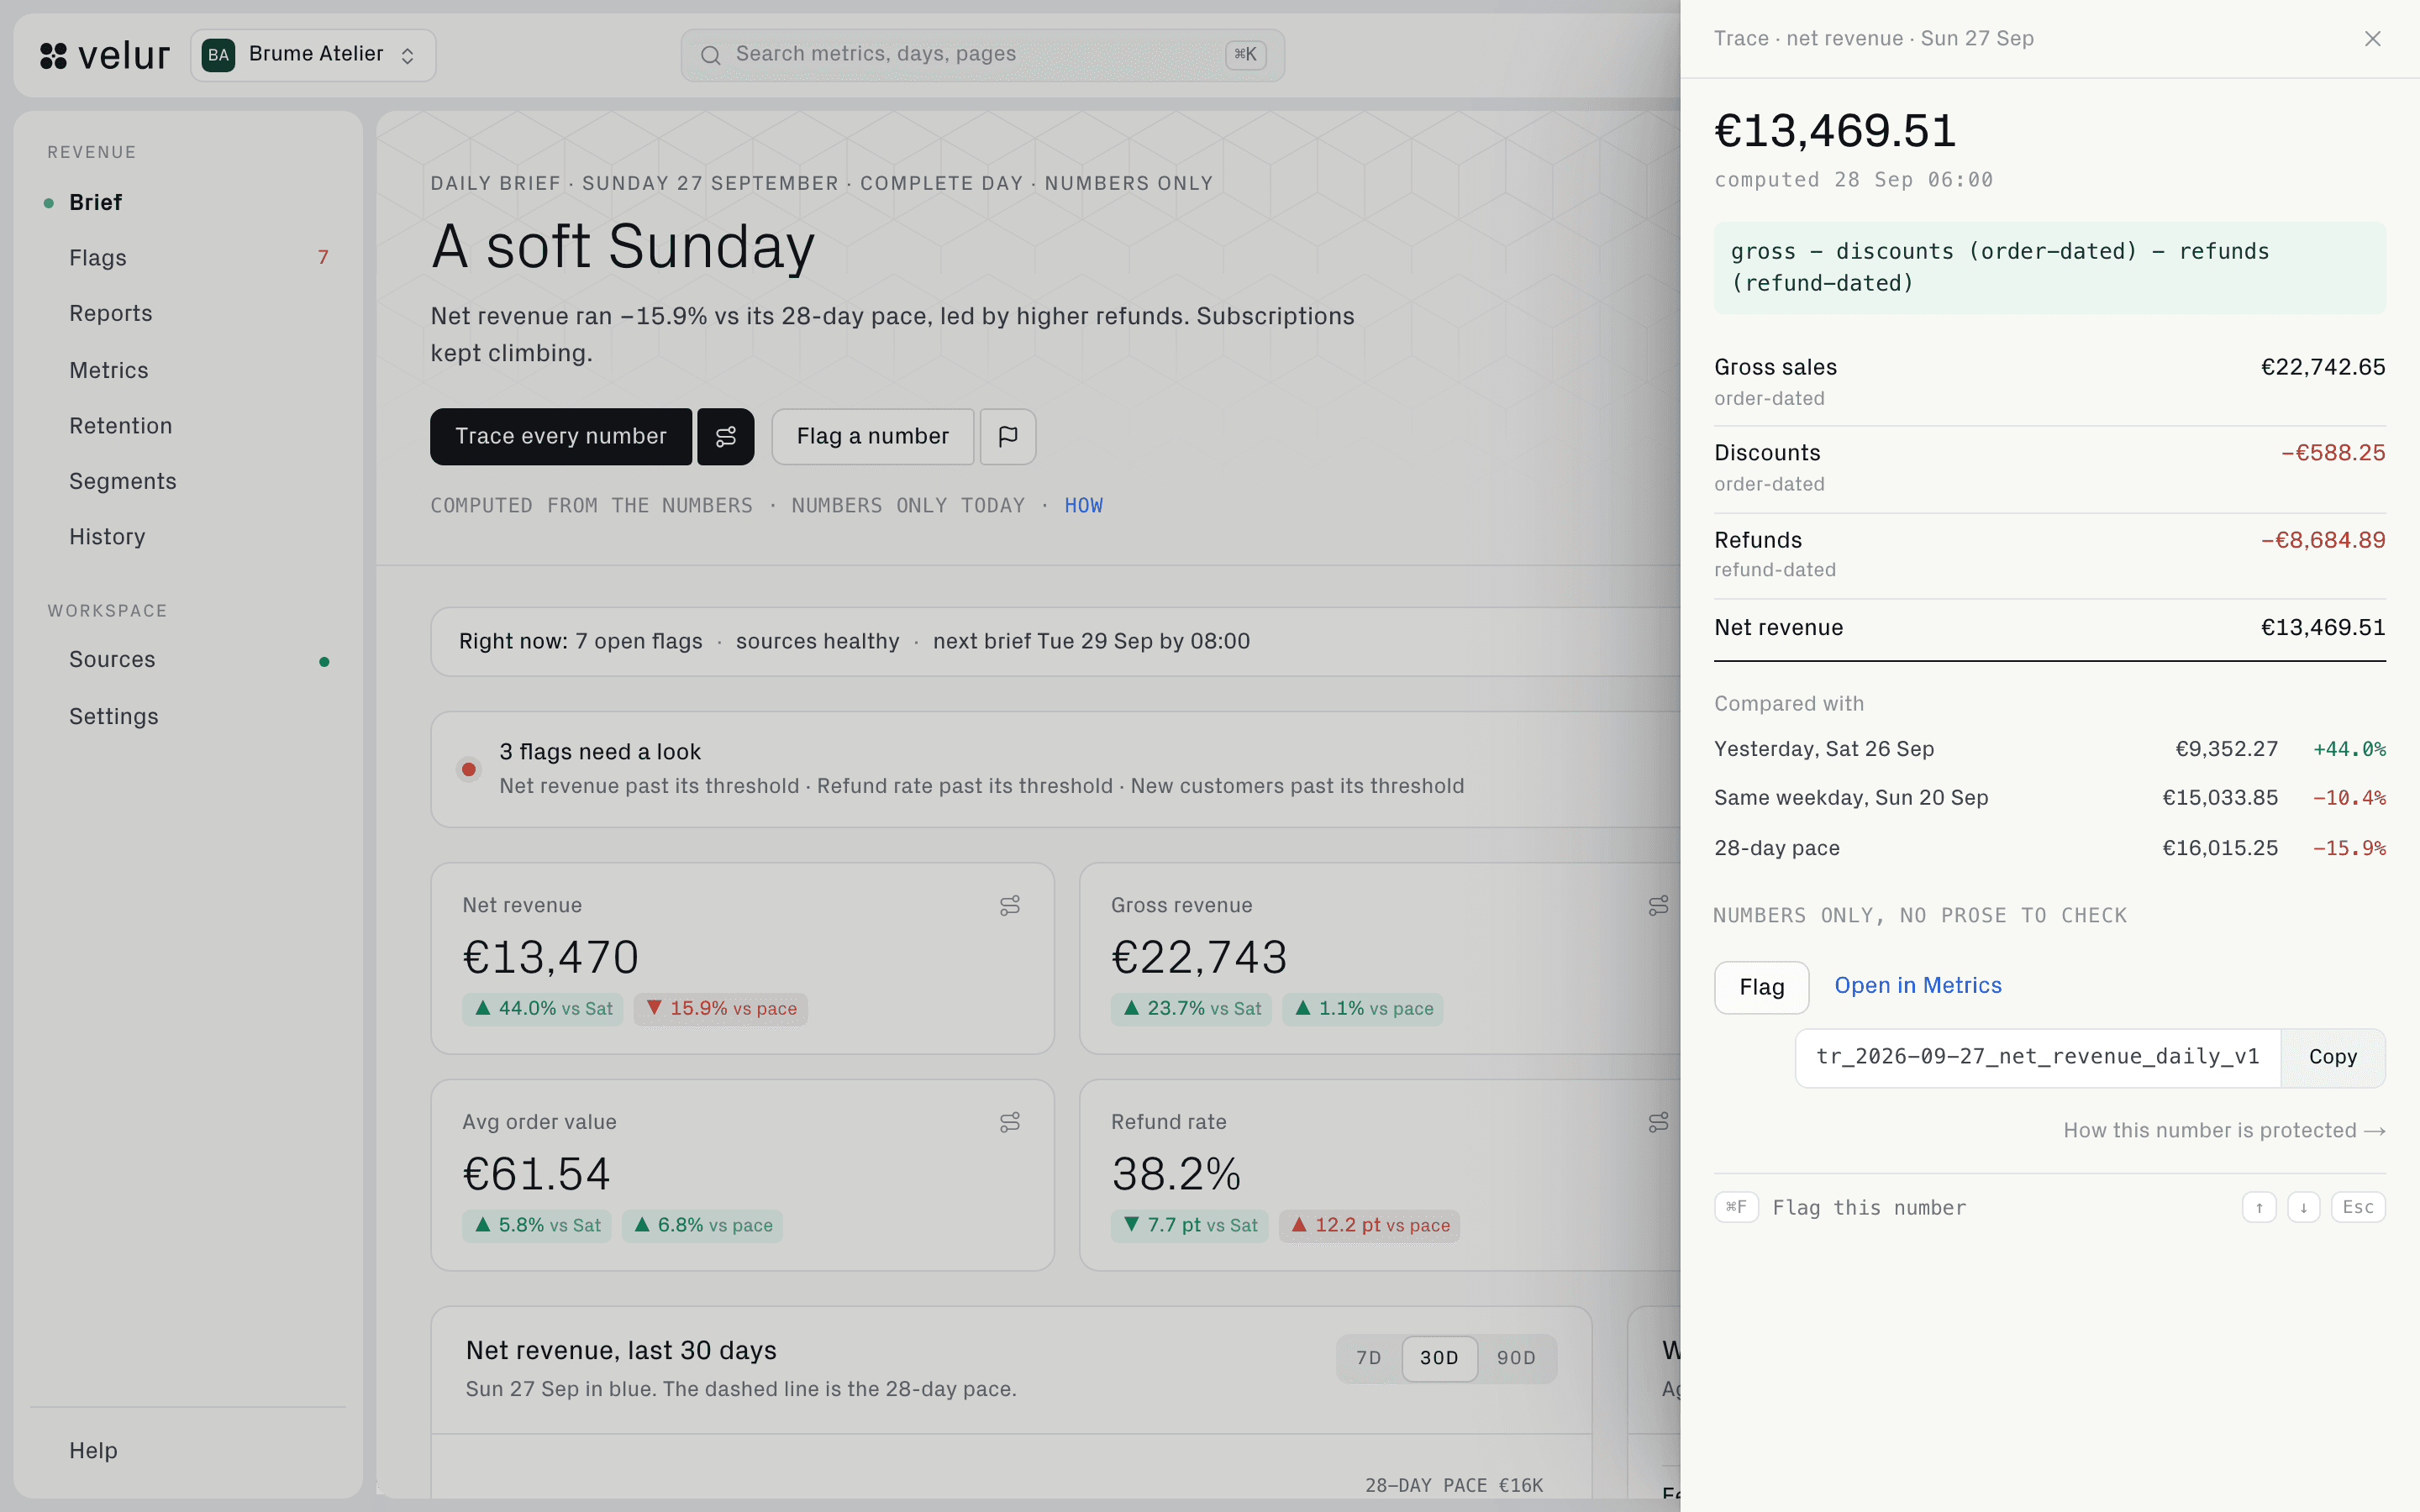
Open any figure and see the formula behind it
You get the arithmetic in words, what the day was compared with, and the trace id that records the check.
Every figure comes from a versioned formula run on your own records, and is stored with the day it describes, so you can check any of them by hand.
- The trace drawer open on net revenue, from the brief
- The formula and the inputs it added up: gross sales, discounts and refunds
- What the day was compared with, and the trace id that records the check

Retention
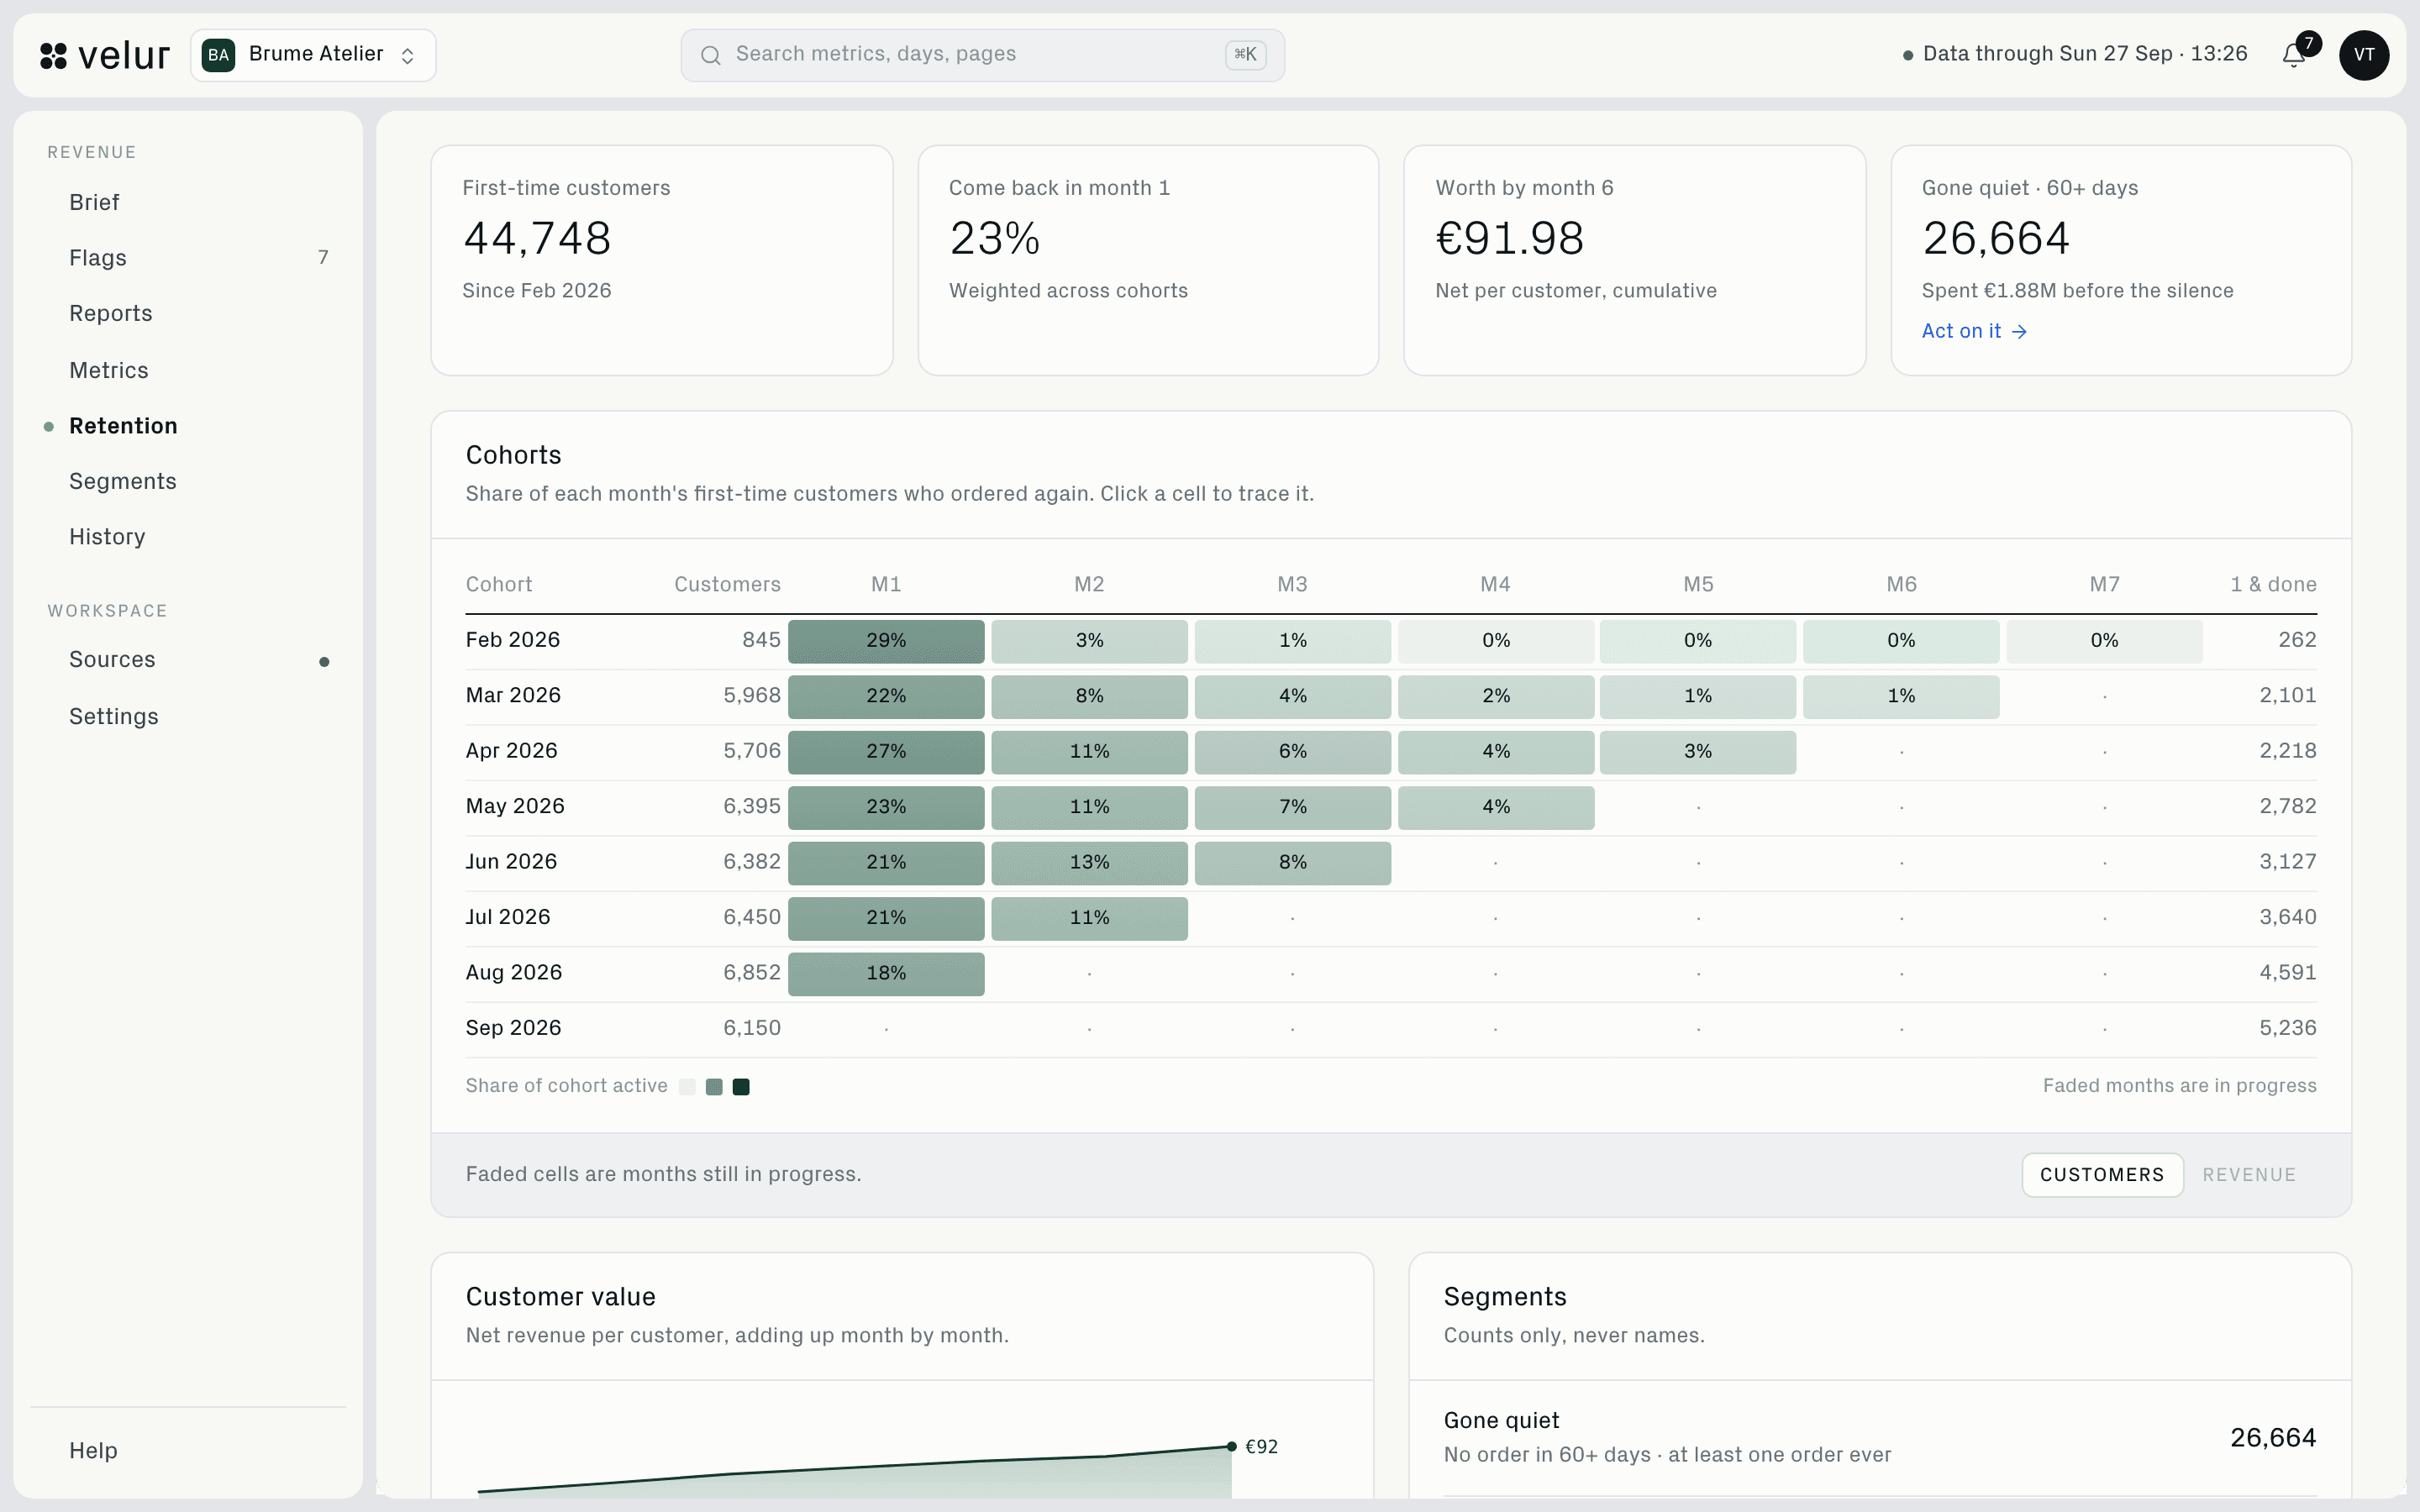
You can tell whether customers come back, and what they are worth
Cohorts are counts and amounts only, never a customer's identity.
Each cohort is followed month by month from the same orders as every other figure, so retention and revenue tie out. We never store a name.
- Each cohort by the month it first ordered, and the share still ordering in every month since
- First-time customers, who came back in month one, and what a customer is worth by month six
- Customer groups as counts and never names, starting with who has gone quiet

How it works
You set it up once, and then we do the rest.
You connect the e-commerce tools you already run, with read-only access
We compute every figure from your own orders, every night
Your brief arrives each morning, and every figure in it is a link
Founding brands get the whole product free for 30 days, with no card.
See what the plan includes